Every subscription audit we undertake, we get asked quite frequently "Is 8% monthly churn normal?"
We know why DTC subscription brands are querying it - it is because they’re trying to benchmark themselves but they’re having to rely on a random stat from a podcast or a competitor's claim, or a number pulled from a tiny sample.
So we partnered with Loop Subscriptions to answer it properly.
[This report is co-written by Adam Kitchen, CEO of Magnet Monster with Piyush Jain, CEO of Loop Subscriptions, the subscription platform behind 2,400+ Shopify brands including MaryRuth's, OSEA and Livingood Daily. The benchmark data comes from 1,971 brands on Loop. The strategies for beating each benchmark come from our subscription work we provide for our clients at Magnet Monster. This report contains both our views combined.]
Loop pulled anonymised data from 1,971 brands with active subscriber bases on their platform, covering March to June 2026.
The result is a percentile view of the four metrics that tell you whether your subscription business compounds or leaks:
- Churn
- ARPU
- Payment recovery and
- Cancellation saves
But why percentiles and not averages?
We believe percentiles are better than averages because a percentile tells you exactly which of these four numbers is costing you the most money but an average tells you nothing about where your DTC brand sits.
How to read this report
A percentile (the "p" in p25 or p90) shows where a value sits when all 1,971 brands are lined up from lowest to highest. p25 means a quarter of brands sit below that value. p90 means only one brand in ten sits above it.
Every table in this report uses the same structure:
- Median = If you’re here, you’re the typical brand on Loop.
- p25 to p75 = This is the healthy band where functioning subscription businesses live.
- p90 = Best-in-class housing the top 10% of brands.
Now, we’d like you to follow two rules before comparing your brand:
- First, benchmark against your category, not the whole portfolio. The same metric swings 50%+ between verticals, so a supplement brand and a candle brand should not be comparing themselves on the same metric. Start with the category table further down this report.
- Second, check the direction note under each table. Low churn is good. A high save rate is good. We spell it out every time so nobody misreads their own position.
Section 1: Churn - the typical brand loses 8%
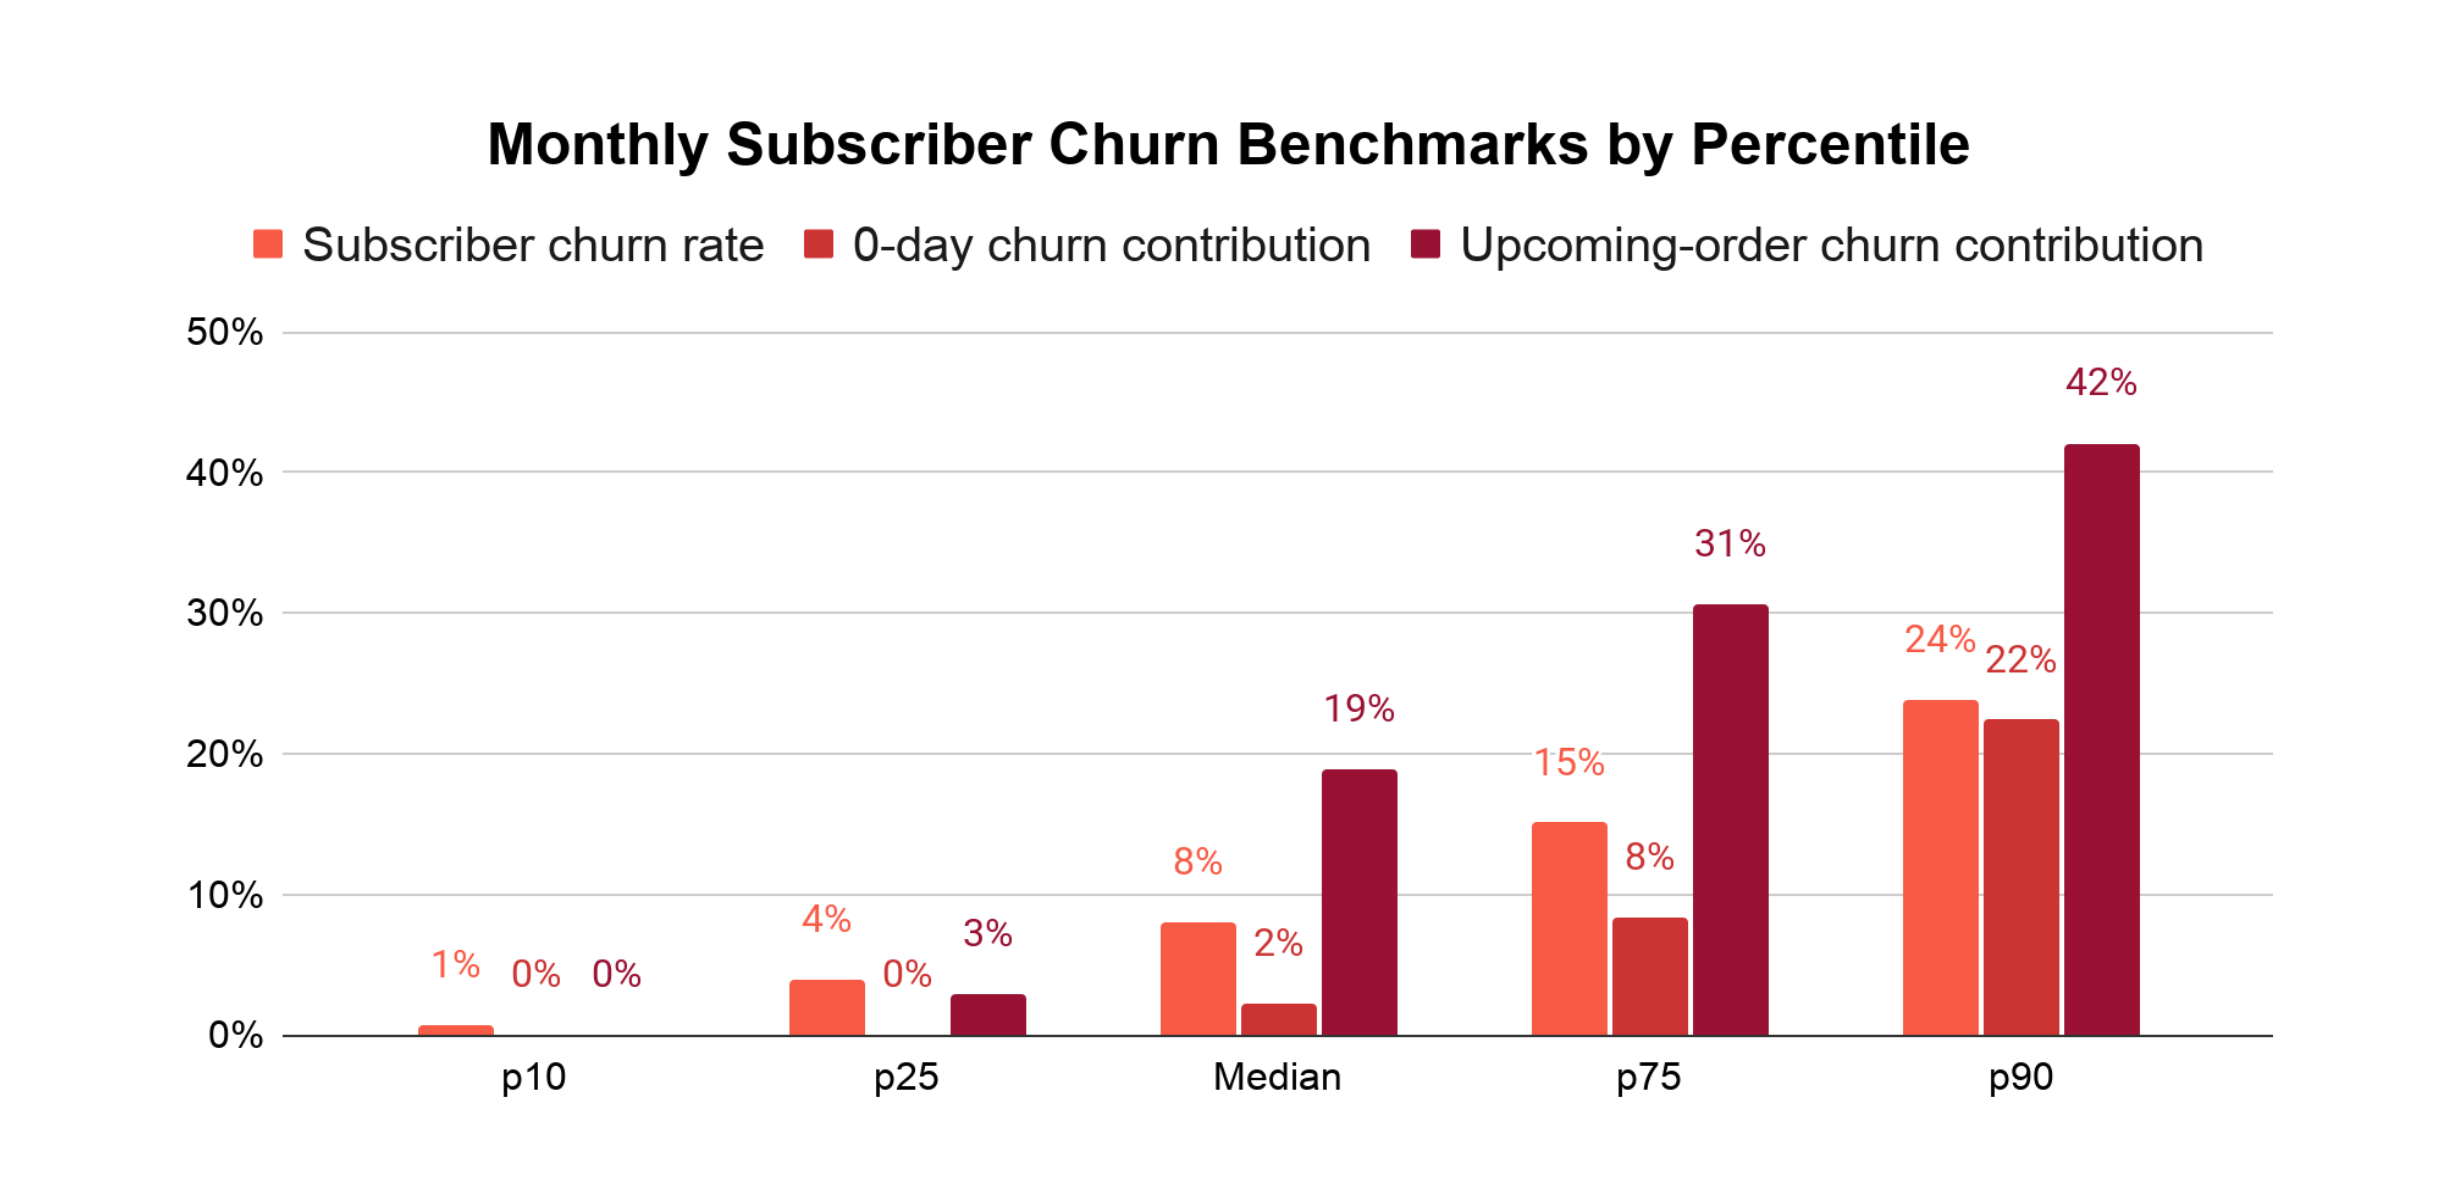
Verdict: Lower is better. All churn figures are monthly rates (rolling 30-day), taken from the Mar-June 2026 data.
The typical brand on Loop loses 8% of its subscribers every month. Under 4% a month puts you in the top quartile. If you’re above 15%, the clock is ticking on your unit economics, because CAC has to be repaid before the subscriber leaves.
We want DTC subscription brands to note two things in this data:
- First, median monthly churn barely moved across the Mar-June snapshots (7.4% to 8.0%). There is no seasonal leak here. Churn at this level is structural, so waiting for a better month will not fix it.
- Second, the biggest controllable slice is upcoming-order churn: subscribers cancelling BEFORE their next renewal. At the median, ~19% of all churn happens in that window.
And that window is exactly where your pre-renewal touchpoints act.
What should you do about subscriber churn:
- Fix the Order Upcoming email first
Give the customer skip, swap and delay options directly in the email, make the rewards in their next order visible, and restate the benefits of staying subscribed. We have seen these changes cut churn from this touchpoint by over 50%. - Attack the first 30 days
Around 70% of subscription churn happens before order 3, so the post-purchase window is activation and habit formation, not upsells. - Hold the cross-sells until order 2-3
Sell to settled subscribers who are using the product, not fresh ones still deciding whether it works.
Read: How to Reduce DTC Subscription Churn in the First 5 Orders
Section 2: ARPU - $58 is the line, $137 is the ceiling
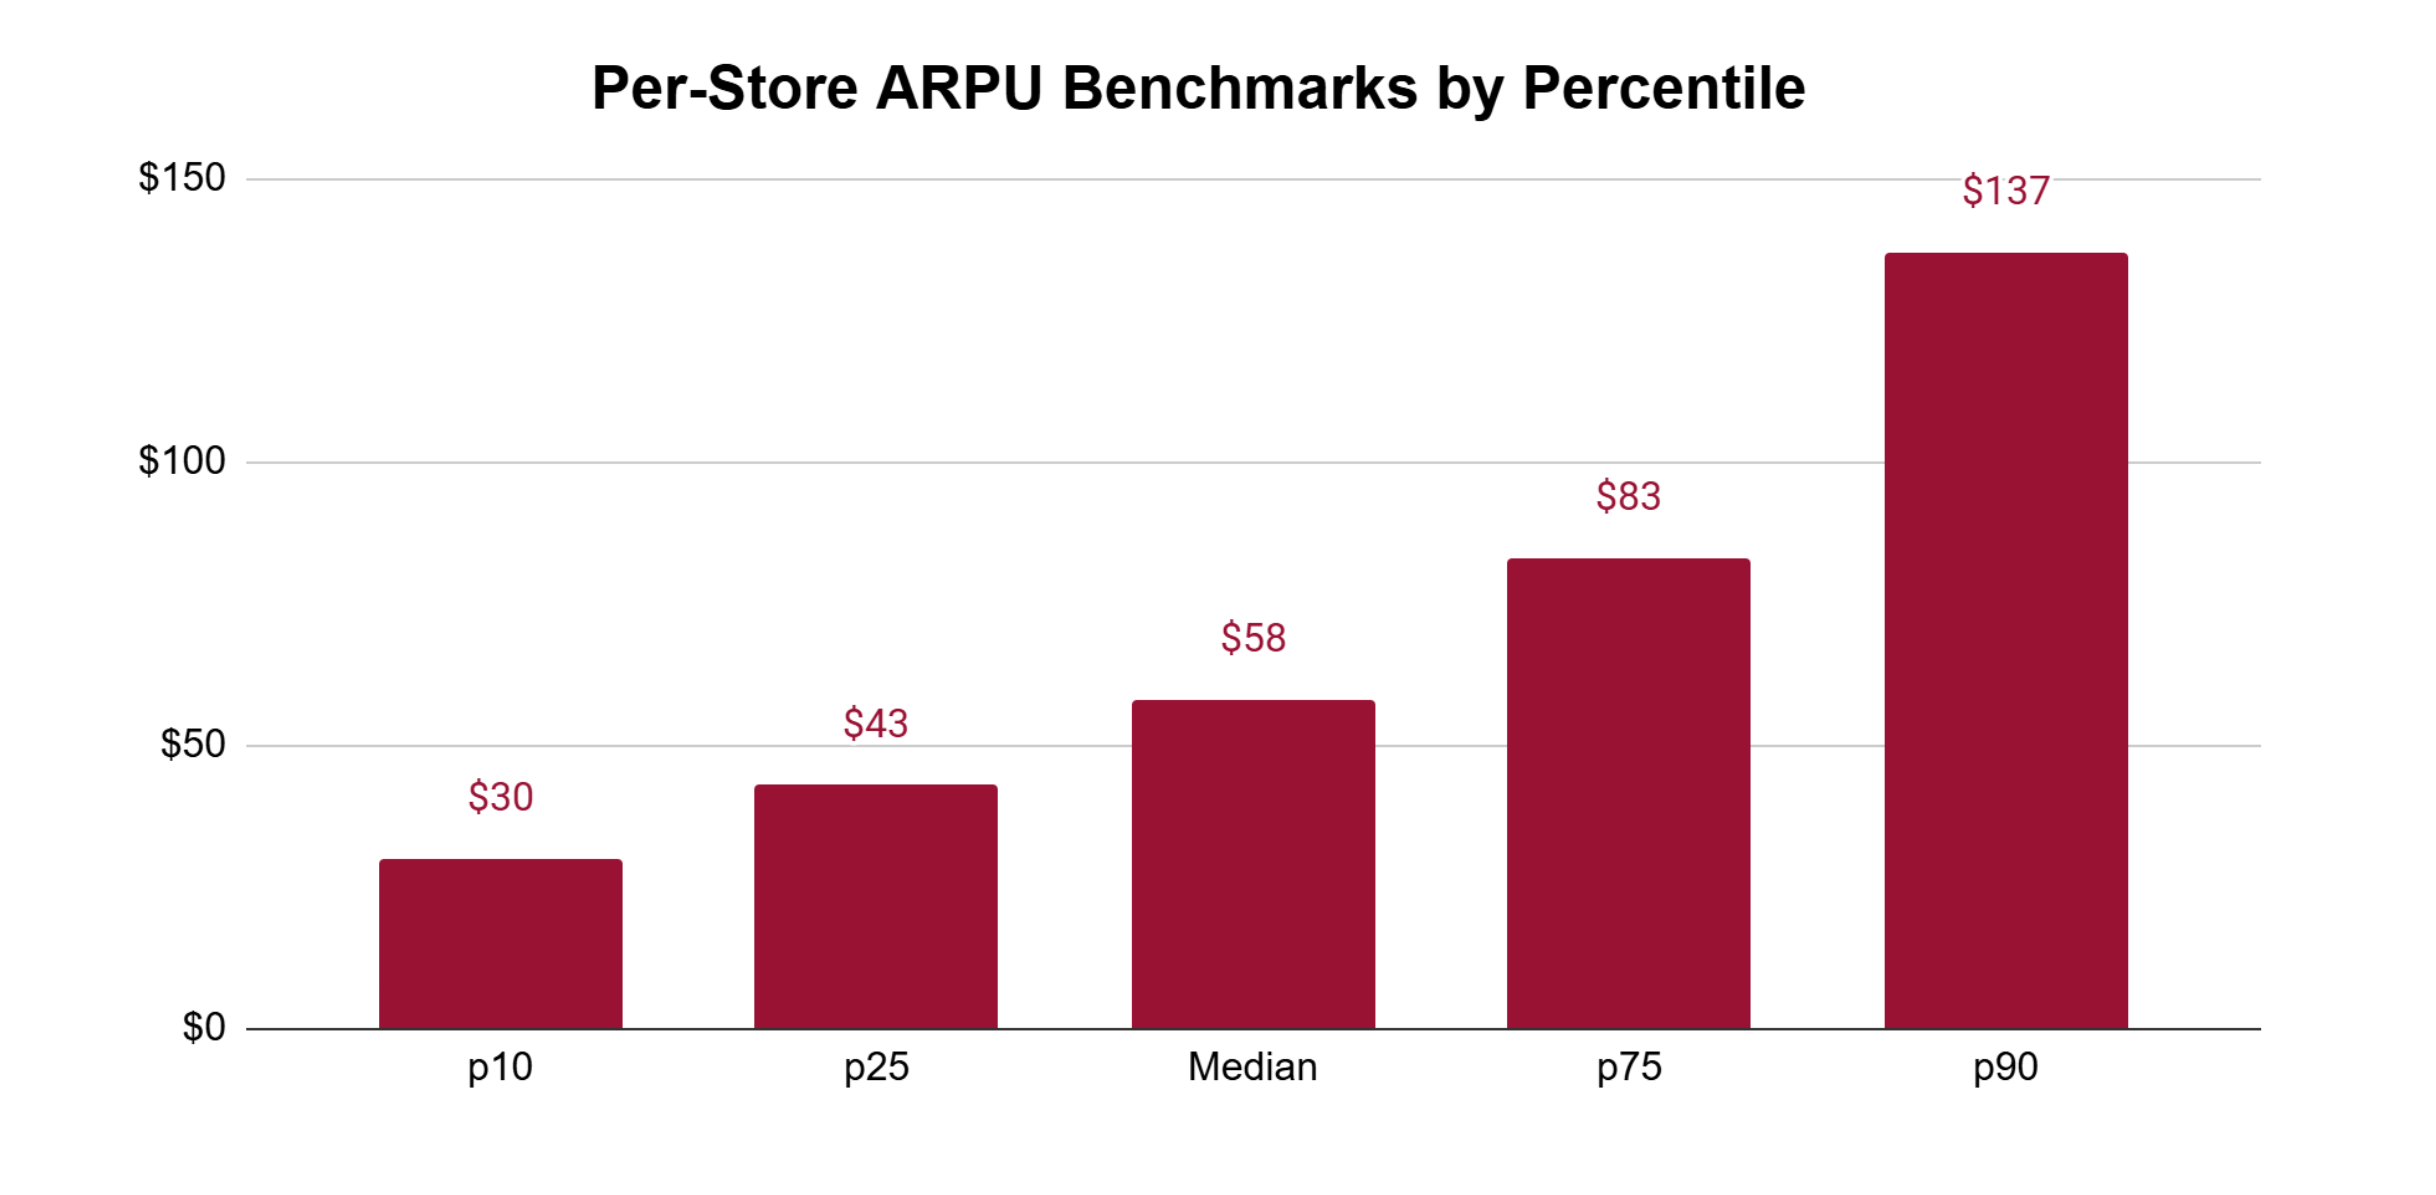
Verdict: Higher is better.
The median brand’s ARPU is $58. The healthy band has an ARPU of $43 to $83, and top-decile brands reach $137.
ARPU is the one metric in this report a brand controls most directly. But when we talk about churn, you can never push it to zero, because some subscribers will always cancel no matter what you do. And you can never stop every payment failing, because banks decline cards for reasons you will never see.
But your pricing, your bundles and the offers you put in front of existing subscribers are entirely your own decisions.
What should you do about ARPU?
- Cross-sell past order 3
Roughly 70% of churn happens before the third order, so subscribers beyond it are settled, happy and the safest cohort to grow. Most brands are too scared to message them at all, and that fear is the gap between $58 and $137. - Frontload the subscription
Offer more product upfront framed around the saving on daily consumption. More cash collected now, fewer renewal decisions later. - Run bundle campaigns to existing subscribers
Trust is already built, so AOV-led offers convert here better than anywhere else on your list. - Use the portal, not just the inbox
Native upsells and one-click add-ons at the point where subscribers already manage their orders.
Read: How to Email Active Subscribers to Grow LTV for DTC Subscription Brands
Section 3: Payment recovery - the 5x gap that brands are ignoring

Verdict: Higher is better.
This is the most important table in this report.
First-attempt success sits steady near 88%, so roughly ~12% fails on the first try for the typical brand.
The bottom quartile recovers under 15% of those failed charges while the top decile recovers 72%. Both groups of subscription brands use Loop tools, so the gap is largely how they set things up - and 72% is almost 5x more than 15%.
By setup, we mean how many times they retry the card, whether they prompt customers to update their details, and whether a backup card is on file.
And this is involuntary churn: the customer wanted to stay but the card didn’t allow them. That makes it the cheapest churn to fix, because there is nobody to persuade and nobody to win back.
What to do about it:
- Set 5-15 retries
Yes, that many. One retry email and a shrug is how the bottom quartile got there. - Automate card-update emails
In our experience, around 70% of recovered revenue comes through the customer updating their card, so that prompt matters. - Notify before cards expire
A message 30 days out with a one-click update link stops the failure happening at all. - Reward the final touchpoint
A small loyalty bonus for updating payment details converts the stragglers.
Section 4: Cancellation saves - most brands never switched the flow on
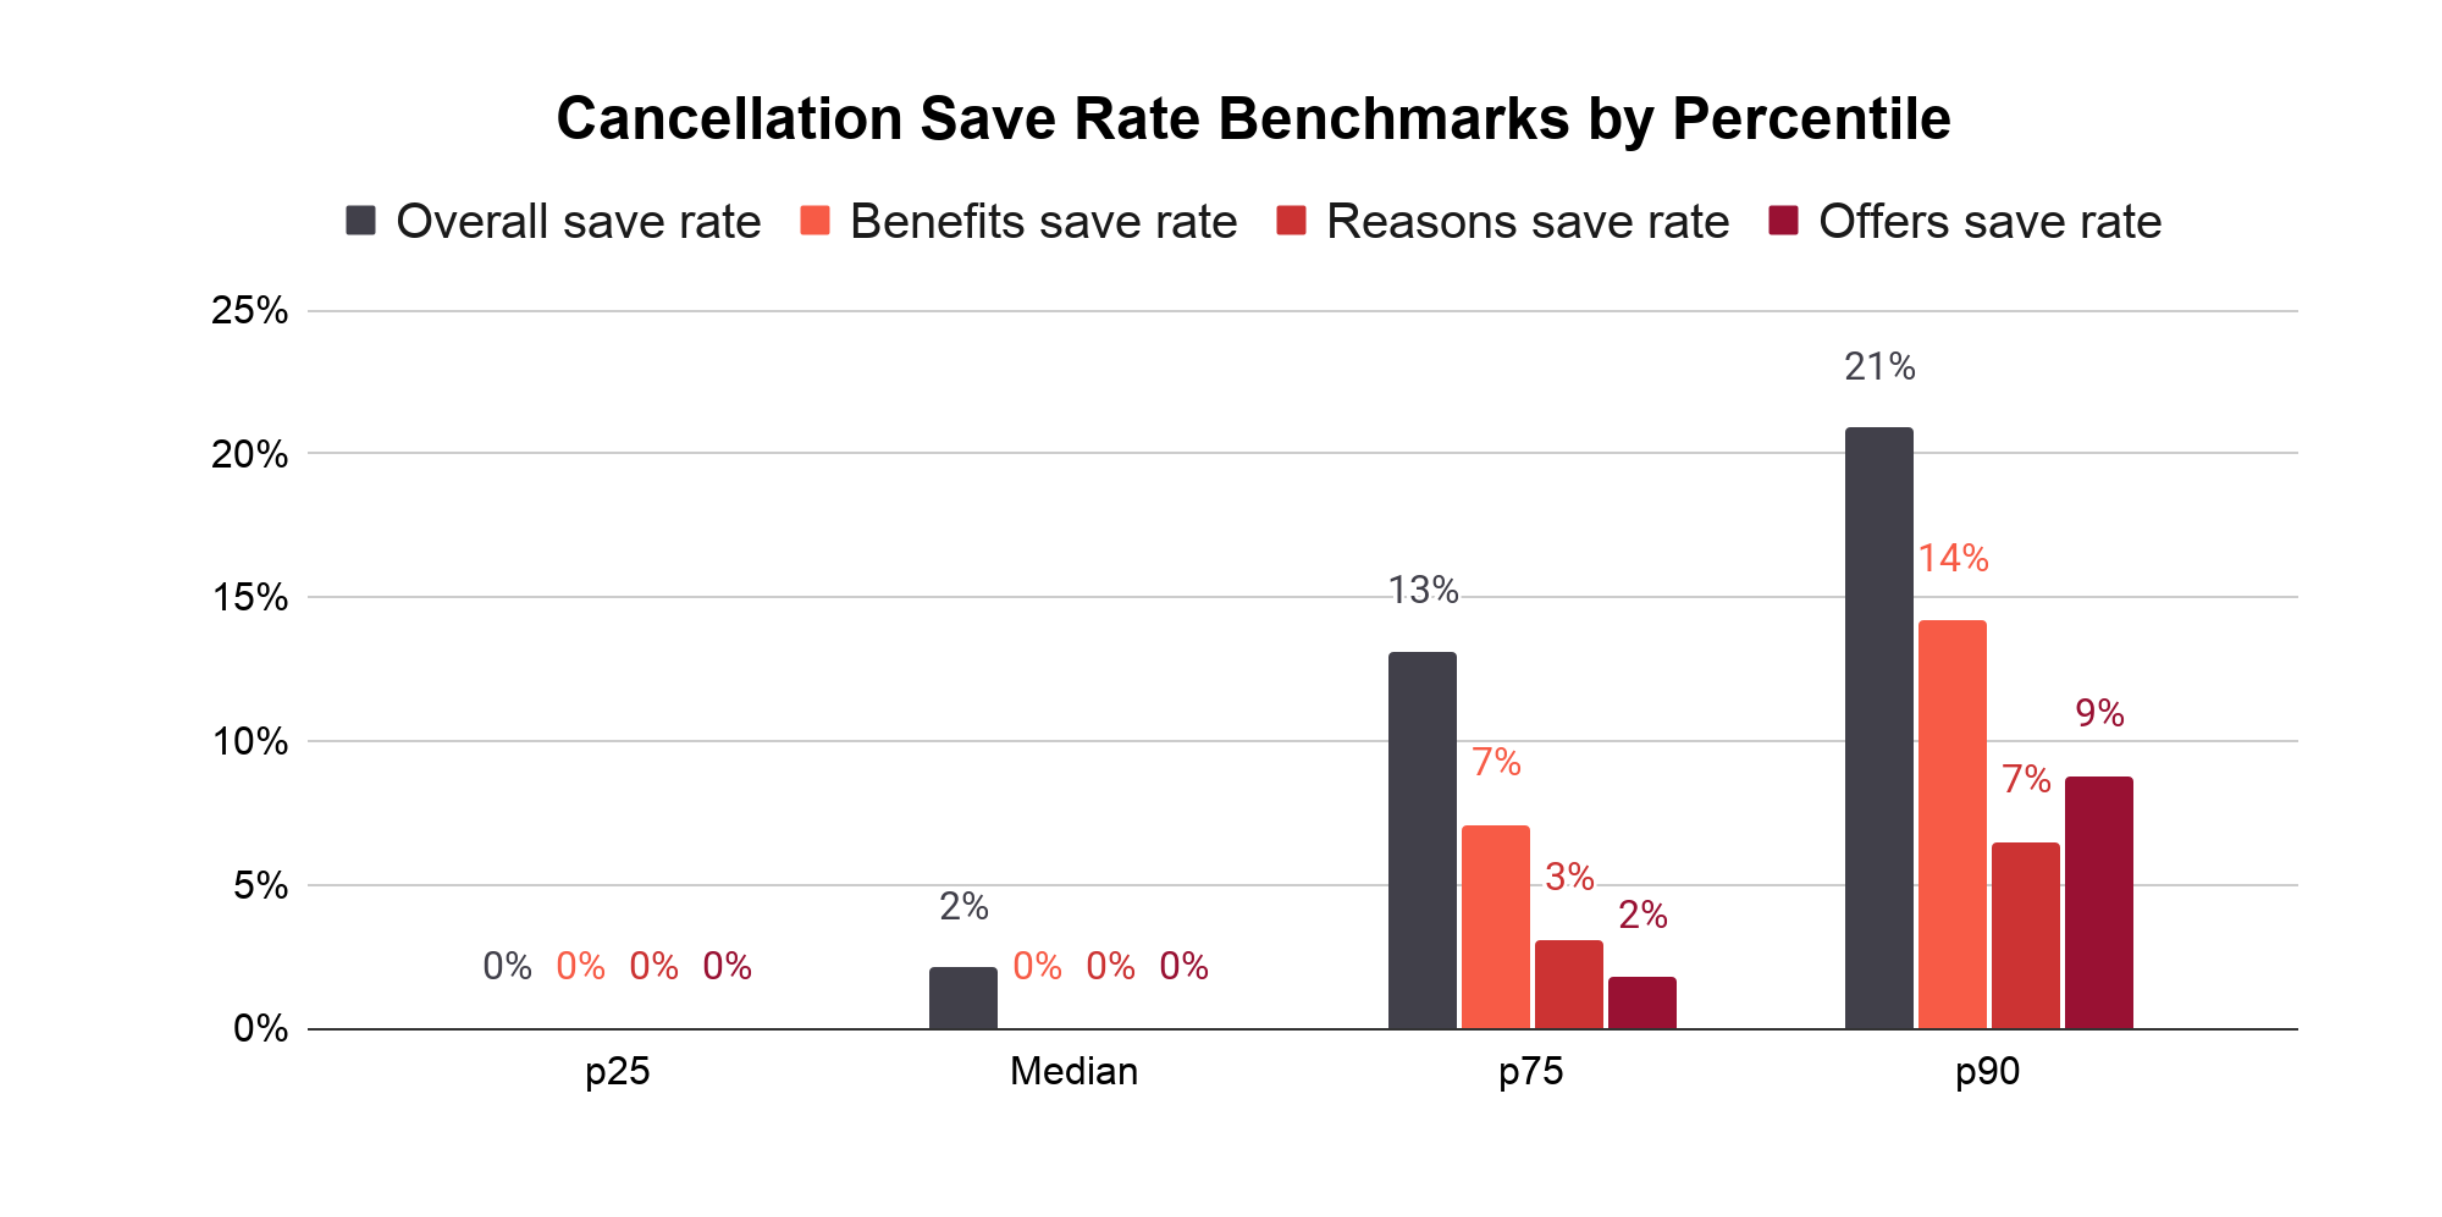
Verdict: Higher is better.
A 2.1% median save rate looks damning until you understand why it is so low.
A large share of brands have never built a cancellation flow at all. Some keep one-click cancellation for compliance reasons, and some choose it deliberately.
But look at the top of the distribution.
Brands that built a proper cancellation flow keep 13% to 21% of the subscribers who tried to cancel. The gap between the typical brand and the best ones comes down to who switched the flow on, because the flows clearly work for the brands using them.
Here is why the portal matters so much: around 60-70% of DTC subscription portal visits end in a negative action - a cancel, skip or pause. By the time your winback emails fire, the decision has already been made. The portal is your first line of churn defence, and email is the second.
What to do about it (in this order):
- Benefits page first
Remind the customer why they subscribed before they reach the cancel button. - Flexibility second
A pause, a slower cadence or a swap beats losing the subscriber entirely. - Offer third
A smaller or cheaper pack or a targeted discount, used after flexibility, not instead of it. - Capture the reason either way
Sync cancellation reasons back to Klaviyo and trigger personalised winback 30-60 days later based on the specific pain point. A blanket discount to all churned subscribers ignores why they left.
Read: Don’t surrender at your last line of defence
Category benchmarks - compare against your vertical
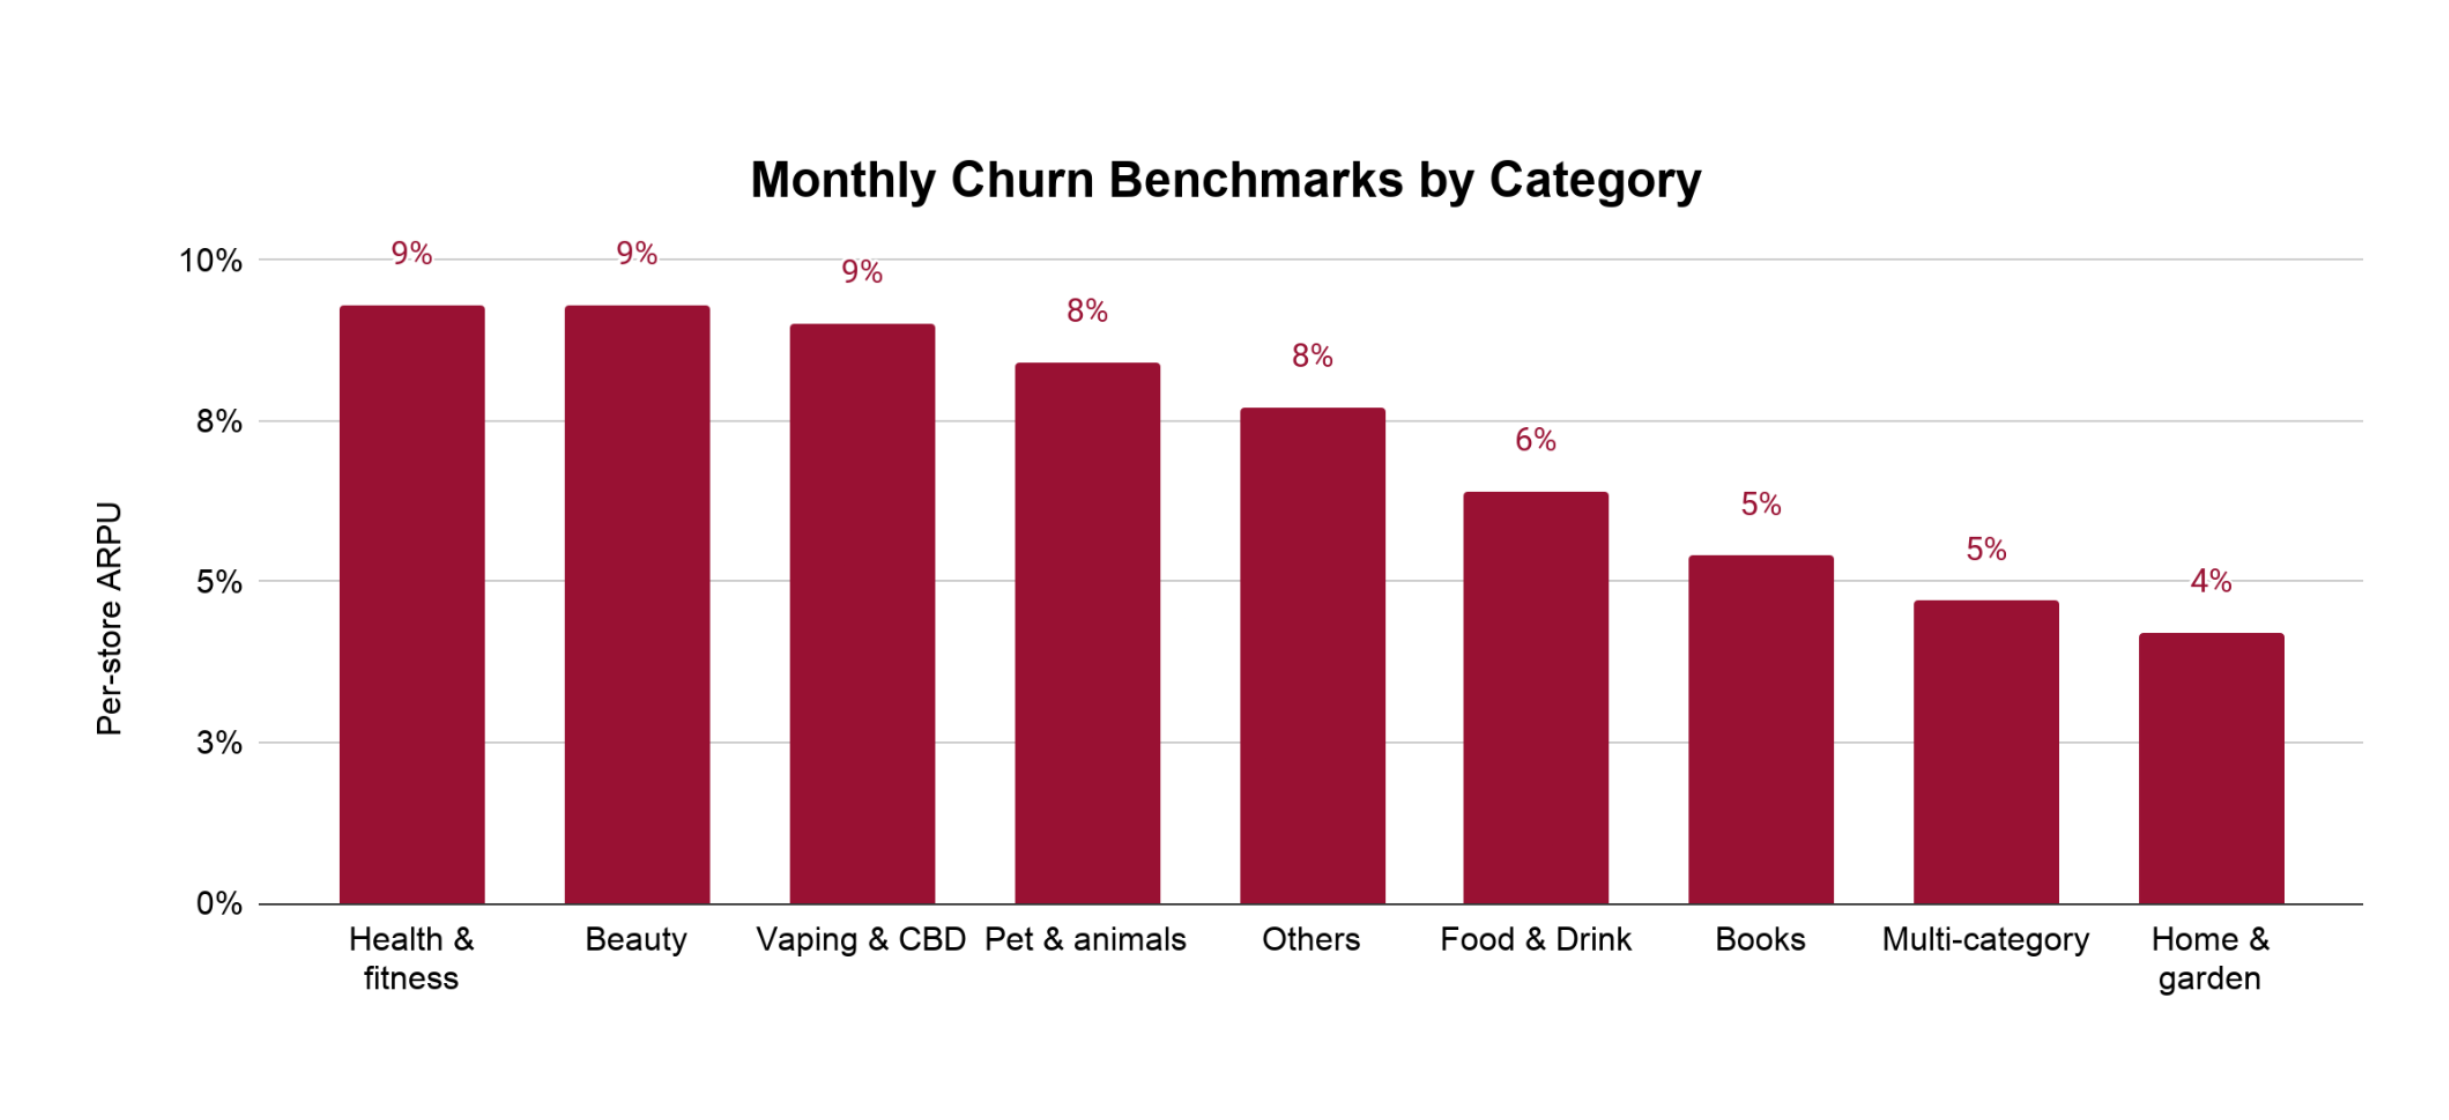
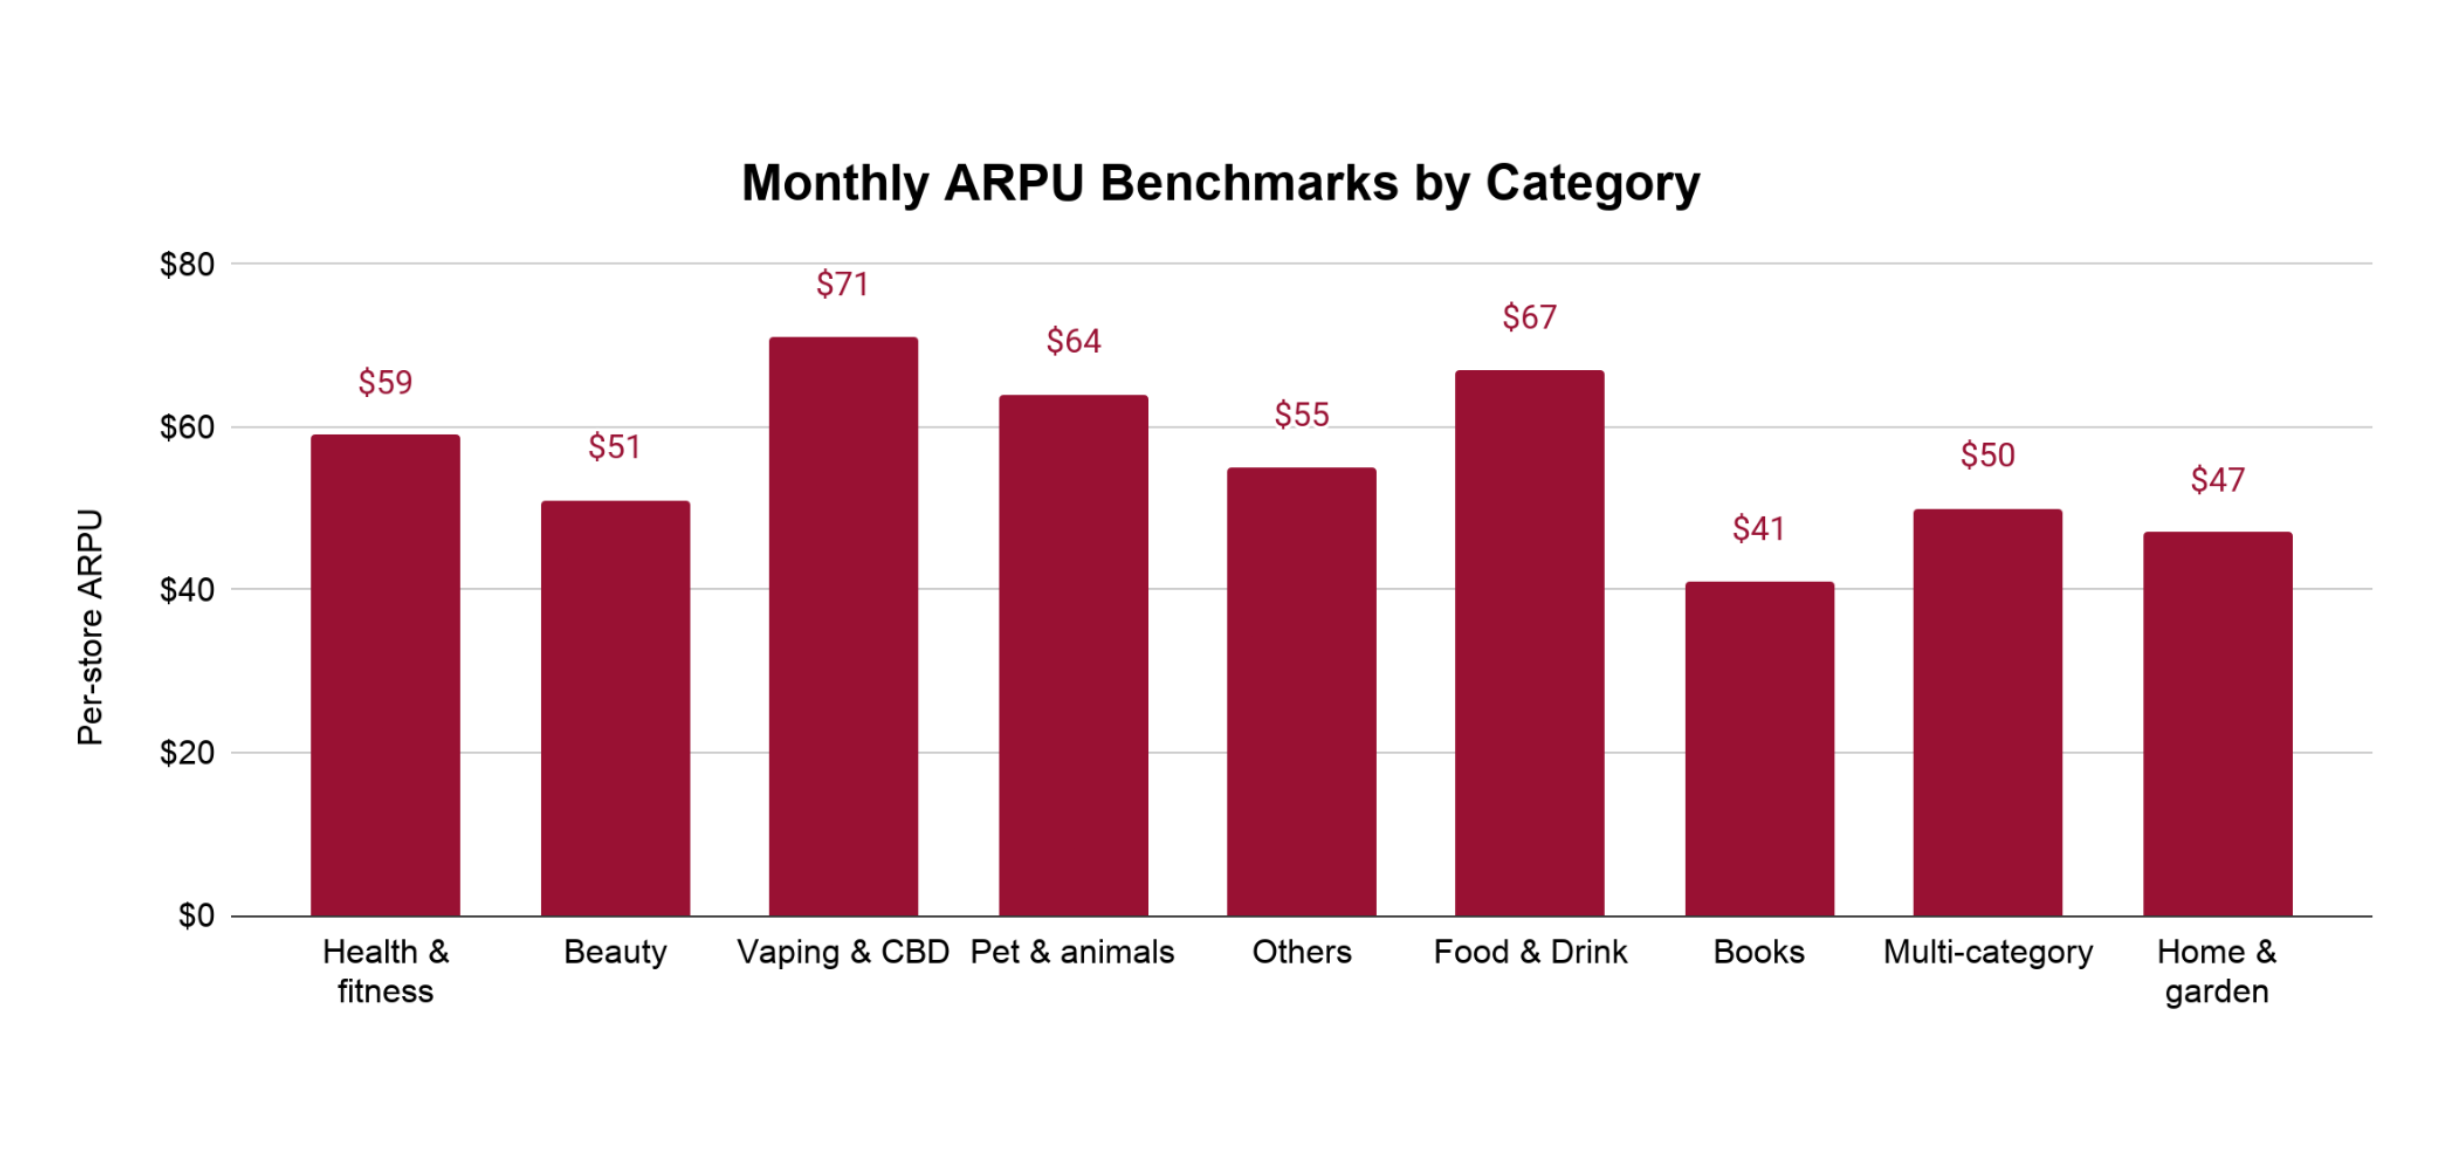
Sorted by churn, highest first. Lower churn is better; higher ARPU is better.
The same metric swings by more than double between verticals, so the all-brands median is not exactly relevant as a benchmark for your specific brand.
A supplement brand at 9% churn is at median for its category. A home goods brand at 9% has a serious problem. Same number, opposite verdicts.
Here’s what the table reveals:
- Products people use up and reorder keep subscribers best
Home & Garden, Multi-Category and Books sit lowest because their customers run out on a predictable schedule. - Trial-driven categories shed fastest
Health & Fitness, Beauty and Vaping & CBD attract people trying something new, so they lose subscribers fastest - and have the most to gain from the Order Upcoming fixes and cancellation flows in Sections 1 and 4.
Conclusion
The median brand loses 8% of subscribers a month, earns $58 per subscriber, recovers a third of failed payments and holds 2% of cancellations.
The best brands run under 4% churn, earn $137, recover 72% and hold a fifth of would-be cancellations.
So find the table where you sit furthest from p90, and start there.
Want to know exactly where your brand sits against these numbers, and which number is costing you most? Book a subscription audit with us and we will map your account against every benchmark in this report.
FAQ
What is a good subscriber churn rate for a DTC subscription brand?
The typical DTC subscription brand on Loop loses 8% of its subscribers every month. Getting under 4% a month puts you in the top quartile. If you're above 15% a month, your unit economics are at risk, because customer acquisition cost usually isn't repaid before the subscriber leaves. Median churn barely moved across a four-month snapshot (7.4% to 8.0%), so this is a structural problem, not a seasonal one.
What is a good ARPU for a DTC subscription brand?
Across 1,971 Loop brands, the median subscriber ARPU is $58. The healthy band sits between $43 and $83, and top-decile brands reach $137. ARPU is the metric a brand controls most directly, since pricing, bundles and the offers shown to existing subscribers are entirely internal decisions, unlike churn or payment failures.
How much failed subscription payment revenue can actually be recovered?
First-attempt payment success sits near 88% across the dataset, so roughly 12% of charges fail on the first try. The bottom quartile of brands recovers under 15% of those failed charges, while the top decile recovers 72%, nearly five times more, using the same Loop tools. The gap comes down to setup: how many times a card is retried, whether customers are prompted to update expiring cards, and whether a backup card is on file.
Why is the median cancellation save rate so low, and how do the best brands do better?
The median save rate across the dataset is just 2.1%, mostly because a large share of brands have never built a cancellation flow at all, some deliberately, for compliance or simplicity reasons. Brands that did build a proper flow (benefits reminder first, flexibility second, an offer third, and capturing the cancellation reason either way) keep 13% to 21% of subscribers who tried to cancel.
Should I benchmark my subscription brand against the whole dataset or against my category?
Against your category. The same metric swings by more than double between verticals, so a 9% churn rate is median for a supplement brand but a serious problem for a home goods brand. Trial-driven categories like Health & Fitness, Beauty, and Vaping & CBD lose subscribers fastest, while categories with predictable reorder cycles like Home & Garden, Multi-Category and Books retain best.
What's the single biggest controllable moment in subscription churn?
The order-upcoming email. At the median brand, around 19% of all monthly churn happens in the window right before a renewal, when a subscriber cancels before their next charge. Adding skip, swap and delay options directly inside that email, making next-order rewards visible, and restating the benefit of staying subscribed has been shown to cut churn from that specific touchpoint by over 50%.
Want more of this in your inbox? Subscribe to our newsletter and YouTube channel for weekly DTC retention strategies, extracted straight from the brands we work with. No fluff, just actionable plays.
Also read:
- Why Your eCommerce Subscription Revenue Has Plateaued (And What To Do About It)
- How to Scale LTV From Your Existing Subscribers: A 4-Play Upsell Playbook for DTC Brands
- Why You're Wrong About Emailing Your Subscribers: The Billing Reminder Playbook (With Brice Douglas, Zaymo)
- Retention Marketing Strategy: A Practical Playbook by Business Model
- How to Reduce Churn and Boost Engagement in D2C Subscriptions Ft Matthew Holman